AI for inventory management: forecasts, reorders and slow stock
AI for inventory management uses the sales and usage history in your ERP to forecast demand for each item, then sets reorder points and safety stock from that forecast and your suppliers’ real lead times. It also flags stock that has stopped moving and picks which items to count next. A distributor or plant can start with the few hundred items that tie up the most cash or run out most often, with a buyer approving every purchase the software suggests. This guide covers each job, the ERP data it needs, and what to do first.

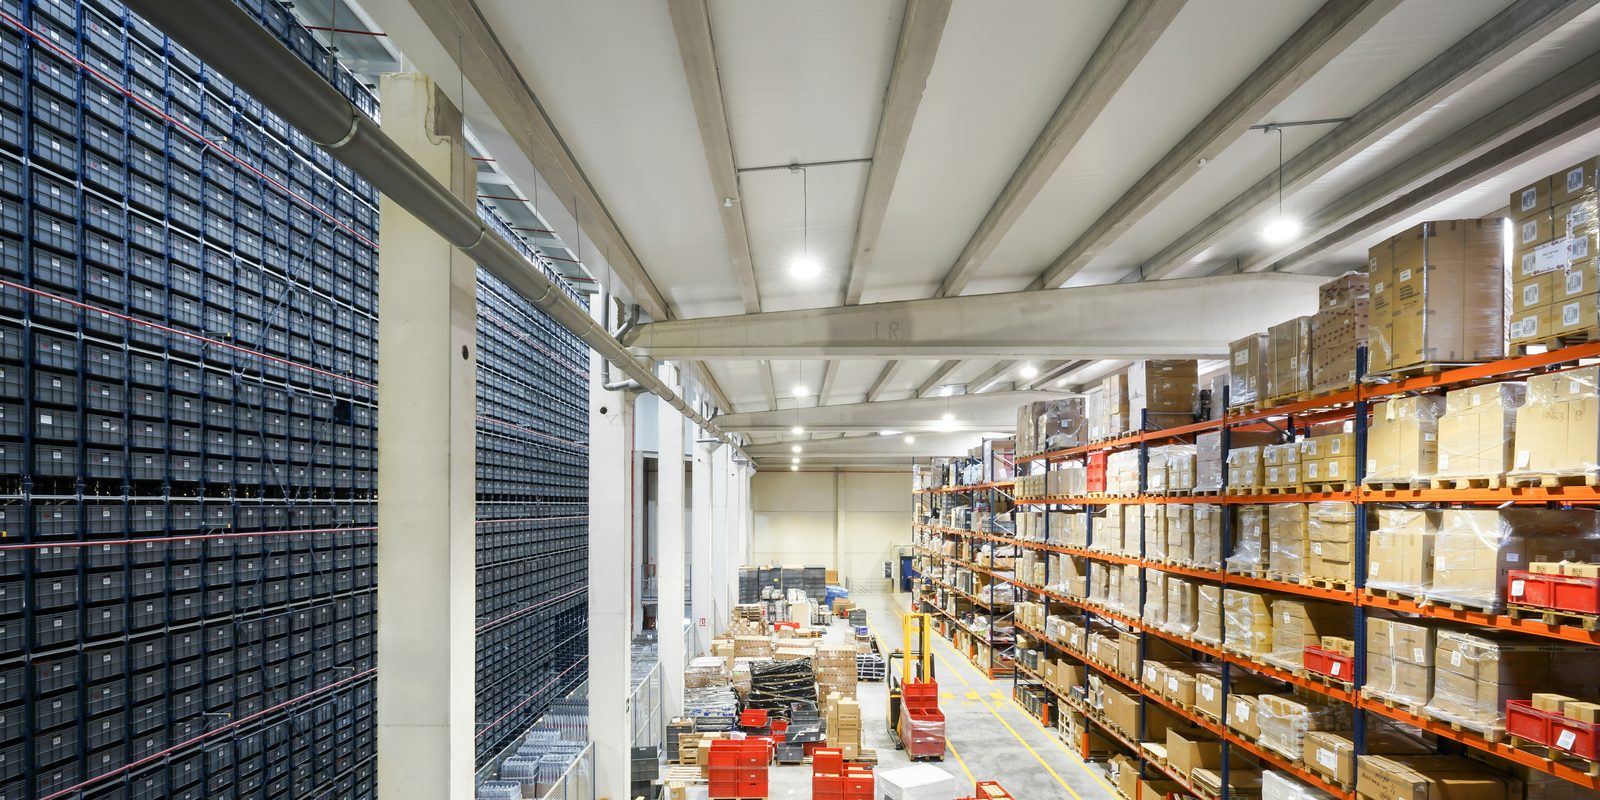
What AI does in inventory management
Inventory ties up cash, and Canadian companies carry a lot of it. Statistics Canada reported that manufacturers’ inventories reached a record $127.5 billion in July 2026, with an inventory-to-sales ratio of 1.62. That ratio is the number of months it would take to sell through current inventory at current sales. For wholesalers the ratio was 1.51. AI does five jobs in inventory, and in each one a person keeps the decision.
| Job | What the software does | What a person decides |
|---|---|---|
| Demand forecast | Projects each item’s sales or usage by month from its history, including seasonal patterns | Adjusts for what the history cannot know: a new customer, a lost contract, a price change |
| Reorder points and safety stock | Recalculates when to reorder from the forecast and the lead times measured on past receipts | Approves the settings for key items and how much stockout risk to accept |
| Purchase suggestions | Drafts a purchase order when projected stock falls to the reorder point | The buyer approves, changes or rejects each one |
| Slow-moving and dead stock | Lists items with no movement in a set period, with their value and months of supply | Whether to return, discount, use elsewhere or write down |
| Cycle counts | Picks which items and locations to count next, and flags count differences | Who counts, and whether to accept each adjustment |
None of this needs new hardware. It runs on the records your ERP, the business system that holds orders, inventory and accounting, already keeps. For the wider picture of buying, moving and storing goods, see AI for supply chain.
Demand forecasting from your sales history
A demand forecast estimates how many of each item you will sell or use in each coming month. The classic methods are simple. Oracle’s documentation for NetSuite Demand Planning lists a moving average, which “projects future inventory by using the moving average of historical demand,” linear regression, which fits a straight-line trend to past demand, and a seasonal average, which “examines past demand to identify seasonal trends.” Machine learning tools choose the method for you. Netstock, for example, says it “automatically assigns the best demand forecasting models for each item.”
Microsoft’s Sales and Inventory Forecast for Business Central uses Azure AI on your sales history, and Microsoft suggests forecasting by month over a 12-month horizon. Its documentation is candid about the limits: “The more data you provide, the more accurate the predictions are,” and “If Azure AI doesn’t find enough data, or the data varies a lot, the service won’t make a prediction.”
Forecasts are weakest on new items with no history, on items bought by one or two large customers in big irregular orders, and on one-time projects. A person should set those by hand. To check a forecast before you rely on it, hide the last six months of history, forecast them from the months before, and compare the result with what actually sold. A plant then turns the forecast for finished products into demand for parts through its bills of materials, the lists of components in each product, which is what the ERP’s material requirements planning (MRP) does.
Reorder points and safety stock
A reorder point is the stock level at which you order more. Business Central’s planning documentation puts it this way: reorder proposals are typically released only “when the projected available quantity is equal to or below a given quantity. The reorder point defines the quantity.” NetSuite gives the standard formula: “Reorder point = (daily sales velocity) × (lead time in days) + safety stock,” where safety stock “serves as a cushion for unexpectedly high demand or slow deliveries.” Lead time is the time from placing an order to having the goods ready to use or sell.
The table works one example: an item that sells 8 units a day, with 30 units of safety stock. The only change is the lead time.
| Using the supplier’s quoted lead time | Using the lead time measured on receipts | |
|---|---|---|
| Average daily demand | 8 units | 8 units |
| Lead time | 10 working days | 14 working days |
| Demand during the lead time | 80 units | 112 units |
| Safety stock | 30 units | 30 units |
| Reorder point | 110 units | 142 units |
The supplier quotes 10 working days, but its last receipts took 14 on average. A reorder point built on the quote runs out before the order lands. Software can close that gap. It measures the real lead time for every item and supplier from the dates on past purchase orders and receipts, recalculates the reorder point each month, and lists the items whose settings no longer match what happens. The buyer approves each change. Purchase suggestions become orders in the ERP, and AI in procurement covers that step.
Slow-moving and obsolete stock
Slow-moving stock sells or gets used far more slowly than you hold it. Obsolete stock, sometimes called dead stock, has not moved in a set period, such as a year, or goes into no product you still make. Software lists both with their value and months of supply, and for a plant it checks the bills of materials so a part used in an active product is not flagged by mistake.
Holding stock costs more than its purchase price. The Business Development Bank of Canada (BDC) lists inventory holding cost as “storage space, utilities, insurance, shrinkage, financing, warehouse personnel, inventory counts, obsolescence.” There is an accounting side too. Under the international standard IAS 2, “Inventories are measured at the lower of cost and net realisable value,” and a write-down is “recognised as an expense in the period the write-down or loss occurs.” Your accountant decides the write-down. The software gives them the list and the history behind each line.
Cycle counts
Microsoft’s documentation defines cycle counting as “a warehouse process that you can use to audit on-hand inventory items,” counting a few locations at a time through the year in place of one full physical count. Counted quantities that differ from the system go to a status of “Pending review” until someone resolves them.
Count what matters most more often. BDC notes that “Eighty percent of a company’s sales are typically generated by 20% of its products.” Software can pick the next counts from the records: high-value items, fast movers, items with negative on-hand quantities, and items whose last count was off. It then flags the differences for a supervisor to accept or reject.
What AI for inventory management needs from the ERP
Every job above runs on data the ERP already holds. The work is getting it out cleanly and fixing what is wrong with it.
| Data | Where it usually lives | Why it matters |
|---|---|---|
| Item records: number, description, unit of measure, cost, main supplier | The item card in the ERP | Every calculation keys off the item number and its unit |
| Transaction history: sales, shipments, use in production, returns | The item ledger or inventory transactions | The forecast reads it. Business Central’s forecast uses the posting date, item number and quantity of sale entries |
| On-hand quantity by location | Inventory or warehouse module | The starting point for projected stock |
| Open purchase orders and their promised dates | Purchasing | Stock already on the way |
| Receipts against past purchase orders | Purchasing and receiving | Measured supplier lead times |
| Open sales orders and quotes | Sales | Demand you already know about |
| Bills of materials | Manufacturing | For a plant, turn demand for finished products into demand for parts |
| Minimum order quantities, pack sizes and order multiples | Item or supplier records | Round each suggestion to what the supplier will ship |
Watch for three data problems. Units of measure that change over time, such as an item sold by the each and later by the box, distort every forecast. Duplicate item numbers split one item’s history in two. Stockouts hide demand, because an item that was out of stock shows no sales for those weeks, and a model reads that as no demand. If your ERP has no export or API, legacy ERP automation covers reading an older system through its screens, and AI for ERP covers the other routes.
What a distributor or plant can do first
- Export the history. Pull two to three years of transactions, current on-hand quantities, open orders and the current reorder settings for every item.
- Pick the first items. Start with the items that make most of your sales or usage, plus every item that ran out in the last year.
- Test the forecast. Forecast the last six months from the months before them, and compare with what actually sold.
- Measure lead times. Calculate each supplier’s real lead time from order and receipt dates.
- Recalculate the settings. Compute new reorder points and safety stock, and have the buyer review every item where they differ from today’s.
- Run it alongside the buyer for a month. The software drafts purchase orders and the buyer approves each one. Human in the loop explains how to set up that approval.
- Track the result. Record stockouts, inventory value, dead stock value and inventory turnover, which BDC defines as “Cost of goods sold (COGS) / Average inventory”.
Find out what your ERP data can support
Tell Derik which ERP you run, how many active items you carry and where stockouts hurt most. He will tell you which of these jobs your data can support today.
Start a conversationInventory software with AI forecasting
Several ERPs now include forecasting, and planning tools connect to the ERP from outside. The descriptions are the vendors’ own, checked September 28, 2026.
| Product | What the vendor says it does | Worth knowing |
|---|---|---|
| Microsoft Dynamics 365 Business Central, Sales and Inventory Forecast | “predicts potential sales using historical data and gives a clear overview of expected stock-outs,” and helps create replenishment requests to vendors | It “produces aggregated forecast for all locations and variants,” so a company with several warehouses has to split the forecast itself |
| Oracle NetSuite Demand Planning | Projects item demand by linear regression, moving average, seasonal average or the sales forecast | You choose the method and how many past periods it uses |
| Netstock | Helps teams “See where stock is at risk, identify excess, adjust safety stock, and generate smarter replenishment recommendations” | Lists ready integrations with NetSuite, Sage, Acumatica, Microsoft Dynamics, SAP Business One, SYSPRO and others |
Whichever tool you use, ask how it charges, for example per user, per item planned or by quote, and check the vendor’s own pricing page. Ask too where the sales history is sent and processed, and whether the tool keeps a copy. Microsoft says the predictive services behind its forecast “use data only to calculate predictions on demand. They don’t store data.” Private AI for business lists the other questions to put in writing. Spare parts for your own machines follow the same rules, and predictive maintenance covers when they will be needed.
How ThriveAI helps
ThriveAI is an AI engineering company in Ottawa that builds private AI systems on a client’s own data, for manufacturers and distributors in Ontario and Quebec. For inventory, that means reading the item, transaction and purchasing records in your ERP, reconciling them so each item means the same thing everywhere, and drafting forecasts, reorder settings and purchase orders for a named buyer to approve. The platform is designed to keep each client’s data on its own server in Canada. The client chooses a model on that server or a hosted model under a written zero data retention agreement, a contract under which the provider keeps no copy of a request or its answer. A hosted model may process requests outside Canada. Derik Lawlis, the founder, leads every project and stays close to the build. More is on About ThriveAI.